Propellers for F3D Models - Part 3 |
As realistic performance data for current pylon engines are rarely published, some tests were performed with a Cyclon pylon racing engine. This engine represents the average pylon racing engine, similar to a standard Nelson engine, maybe with slightly less peak performance. Nevertheless it can be used as a good example for a typical engine, used during the late 1990s in F3D models.
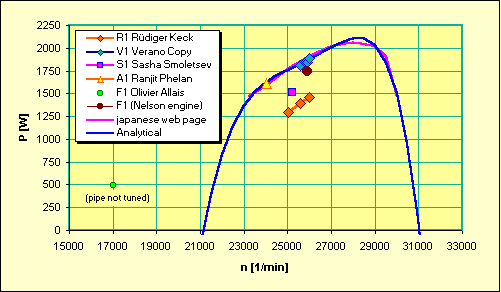
Power curve for the Cyclon pylon racing engine, showing test
results and the polynominal approximation.
Additional information on this engine and the performance data can be found on
my Cyclon page.
| To simplify the following analysis, the power curve was approximated by
a polynominal of the 5th degree
The coefficients for the power curve are listed in the table on the right. The rotational speed n must be entered into the equation in [1/min], the resulting power P is in [W]. The approximation is used mainly in the rpm-range between 23000 and 30000 1/min and may be in error outside of this band. |
|
To find useable data for model propellers in general is very difficult. Even more rare were any data for pylon racing props: they did obviously not exist at all. I had created numerical results for existing propellers as well as new designs for pylon racing propellers several times during the last 10 years, but never had the chance to lay my hands on experimental results for these props. There are some experimental data available for commercially produced propellers, but the selection is very sparse and most of these results were obtained in the 1970s and it is not clear, whether these propellers are identical to the ones in the current catalogues of the manufacturers. Also, all these propellers were completely out of question for application in pylon racing models (would you like to try a Graupner 11x7 prop?).
I was lucky to find (with the help of these web pages) a student, who was working on his diploma thesis and who wanted to test several folding propellers for electric gliders in the wind tunnel of his engineering school. The proposed experimental setup was cleverly designed and professionally manufactured, and I could persuade him to extend his tests by including 5 additional propellers, which I had collected from various sources. These propellers can represent a cross section of typical propellers for pylon racing models. All propellers were molded and consist of carbon fiber reinforced epoxy resin. Unfortunately I had no opportunity to test one of the plastic props from the APC series for Quickie 500 models. Currently, I have no detailed data on the geometry of these props (chord and twist distribution, airfoils), so the following table lists the diameter only. Therefore, the results cannot be used to examine details of the individual propellers, but indicate the bandwidth of typical propellers instead.
| Ident Number | Manufacturer / Source | Approximation | ||
|---|---|---|---|---|
| Graph of Efficiency, Power- and Thrust-Coefficient | Cp | Ct | ||
| R1 | Rüdiger Keck | 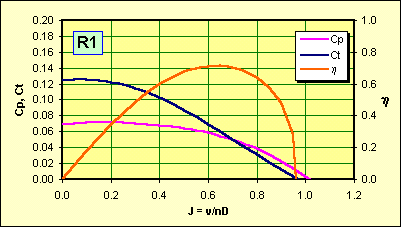 |
a = -0.034322514 c = -0.051291218 d = 0.019543938 e = 0.069678606 |
a = 0.077138003 c = -0.240880654 d = 0.035621280 e = 0.124911214 |
| V1 | Otto Jakob
Copy of a propeller |
 |
a = -0.104099349 c = 0.088318430 d = -0.069311901 e = 0.081954824 |
a = -0.017175002 c = -0.119171439 d = 0.023707746 e = 0.099918653 |
| S1 | Sasha Smolentsev | 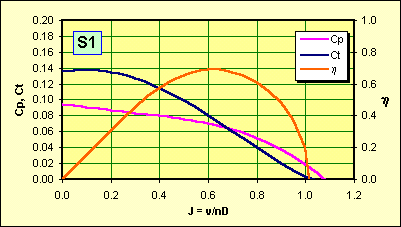 |
a = -0.054370119 c = 0.0195786210 d = -0.040931508 e = 0.094564585 |
a = 0.084054434 c = -0.265367416 d = 0.049860563 e = 0.13526268 |
| A1 | Ranjit Phelan | 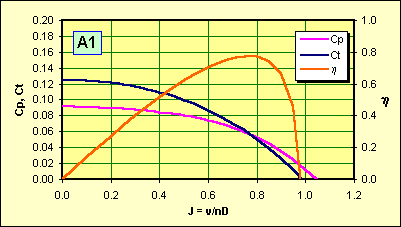 |
a = -0.056728967 c = -0.013303667 d = -0.009811892 e = 0.092276629 |
a = -0.031065478 c = -0.102716349 d = 0.005314393 e = 0.124943028 |
| F1 | Olivier Allais | 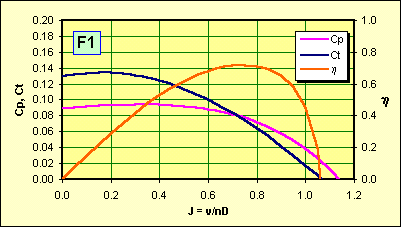 |
a = -0.051452635 c = -0.021372887 d = 0.021469322 e = 0.089868863 |
a = 0.013668170 c = -0.184210937 d = 0.058409855 e = 0.129804473 |
The wind tunnel tests provided a lot of data - several ten thousands of data
points were taken for each propeller, covering a whole range of operating
conditions. To make that huge amount of data useable and better suited for my
poor brain, I created approximations for the power- and thrust-coefficients for
each propeller. This involved some guesswork, sorting and extrapolating, as the
data was spread over a wide band of Reynolds numbers, slightly below the
in-flight values of modern F3D models. But, as the results showed, Reynolds
number effects were covered well enough to extrapolate to flight conditions I am
quite confident in the results. This time, the approximation was based on a
polynomial of the order of 4, with the factor b set to zero. The
coefficients given above can be used to approximate the coefficients as a
function of the advance ratio ![]() .
.
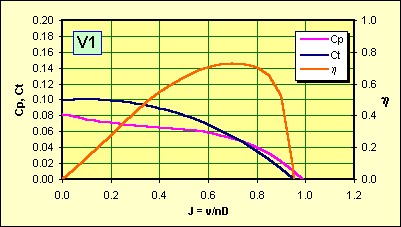
The approximated propeller coefficients and the polynomials are shown in the table above: a first look shows, that the maximum efficiencies fall between 70% and 80%, which is quite good, considering the difficulty to create airfoil like shapes on the small propeller blades. The top runner seems to be the A1 propeller, followed by V1 and F1. But: what counts in the end, is the thrust of the propeller-engine combination. A good efficiency is nice to have, but when the power consumption of the propeller forces the engine to turn the propeller at a speed far away from the optimum v/nD, the performance of the propeller cannot be used. One propeller may work perfectly well on a certain engine, but the results on a different engine may be unsatisfying.
| Together with the performance curve of the Cyclon engine, it was possible to calculate the thrust T versus flight velocity v relation. These curves, as shown on the right hand side, indicate, that the F1 propeller outperforms the A1 propeller, because it "fits the engine" better. The promising V1 propeller looks even worse - a deeper analysis shows, that this prop cannot consume the power offered by the engine, resulting in high engine speeds above the peak power. It would work better on an engine with less power. The propeller S1 shows the highest thrust at low speeds, which will result in good results for the first lap, but during the following laps, it will be outperformed by most of the remaining propellers. | 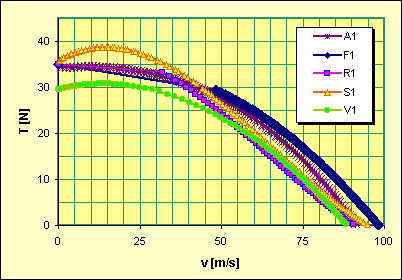 |
Remark:
Similar to the approximation of the engine power curve, some errors are introduced, but I feel, that the data is still representative enough to deliver realistic results during the following simulation steps.
During a race, the propeller-engine combo has to pull the airframe through the straights and turns of the racing course. It is not clear, where in the advance ratio regime the propeller finally operates and what the velocity of rotation of the engine will be in flight. Therefore I wrote a simulation program, which calculates the flight speed and its variation while the model "flies" around the course. Results from these simulations include flight speed and lap times as well as details on airframe aerodynamics (lift and drag) and the operating points of propeller and engine.
Here, I present some results of the simulation: lap times, calculated for each one of the five propellers.
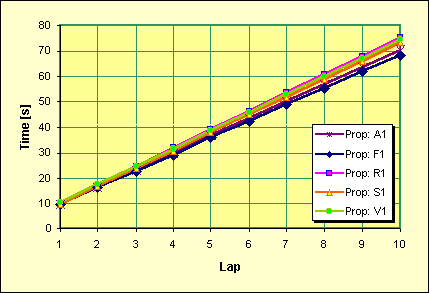 |
The graph on the left side shows the racing time versus laps for each propeller. We can see, that the times diverge with increasing number of laps. The lines are finally ending at race times between 76 and 68 seconds. As all these results were calculated with identical data for engine and model, they represent the performance of the individual engine-propeller combination. |
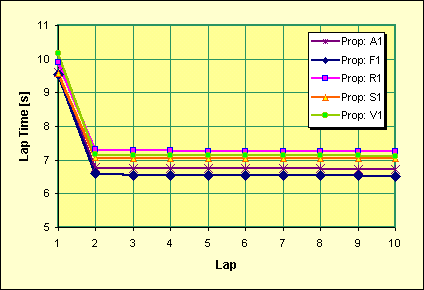 |
Here we see the time for each lap, which makes it clear,
that there is a different order after the first lap (e.g. propeller V1 is
slower that R1 after lap 1), but starting from the second lap, the
differences are nearly constant. Thus propeller F1 performs faster by
nearly 1 second per lap, compared with prop R1, which finally adds up to
the large difference in the end, as shown above.
The net result makes it clear again, that it is still worth to experiment with different propellers, especially when engine and model seem to be performing already fairly well - but that's what you already knew before reading this paper... |
____________________________
¹) Boeing introduced the slogan «Working Together» during the development of the Boeing 777 - I don't know, how they built their planes before... (if you want to read the interesting story of the Triple Seven, slightly blurred by the propaganda department, see [32]).
Last modification of this page: 21.05.18
![]()
[Back to Home Page] Suggestions? Corrections? Remarks? e-mail: Martin Hepperle.
Due to the increasing amount of SPAM mail, I have to change this e-Mail address regularly. You will always find the latest version in the footer of all my pages.
It might take some time until you receive an answer
and in some cases you may even receive no answer at all. I apologize for this, but
my spare time is limited. If you have not lost patience, you might want to send
me a copy of your e-mail after a month or so.
This is a privately owned, non-profit page of purely educational purpose.
Any statements may be incorrect and unsuitable for practical usage. I cannot take
any responsibility for actions you perform based on data, assumptions, calculations
etc. taken from this web page.
© 1996-2018 Martin Hepperle
You may use the data given in this document for your personal use. If you use this
document for a publication, you have to cite the source. A publication of a recompilation
of the given material is not allowed, if the resulting product is sold for more
than the production costs.
This document may accidentally refer to trade names and trademarks, which are owned by national or international companies, but which are unknown by me. Their rights are fully recognized and these companies are kindly asked to inform me if they do not wish their names to be used at all or to be used in a different way.
This document is part of a frame set and can be found by navigating from the entry point at the Web site http://www.MH-AeroTools.de/.