How it all works together |
Besides propeller and engine, the aerodynamics of the model was examined. To calculate the induced drag of the model, simple lifting line theory was used (Multhopp's method). The results included a set of drag polars (drag versus speed) and the time to bank the model into the 90º turns. With the data for model, engine and propeller, we could see how all these components worked together and where improvements could be made.
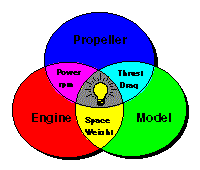
The key system components of a pylon racing model, excluding the pilot.
The following graph shows the drag and the thrust curves for a beginner class pylon racing model, the Quickie 500. It should be noted here, that during these times, the engine speed on the ground was limited to 18000 rpm in the German national classes, because of noise reasons. The data show that we still had enough thrust to accelerate the model to speeds of 200 km/h (unfortunately, no international attempts have been made so far, to tackle the noise problem). At this flight condition the engine was running at slightly more then 21000 rpm. The thrust of the power plant goes to zero, when the speed exceeds 300 km/h, but this speed was unreachable, even when the model would have been put into a vertical dive. In this case the additional "thrust" of the model weight of 1.8 kg and the reduced model drag (no lift needed) would have allowed a top speed of approximately 250 km/h.
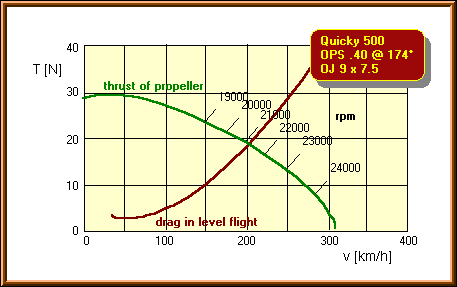
Propeller thrust respectively model drag versus flight speed for a national
beginner class pylon racing model. The model Quickie 500 is a trainer like
standard design.
With all these values it was possible, to simulate the model/engine/propeller system, racing around the course. The following example depicts the speed history of a Quickie 500, equipped with an OPS .40 Pylon engine. The simulation indicates, that the model accelerates during the first lap until it reaches the twin pylon. During the remaining laps the speed varies between 180 km/h and 200 km/h. The take off and acceleration phase takes about 7 seconds, which is nearly 10% of the total time for a race.
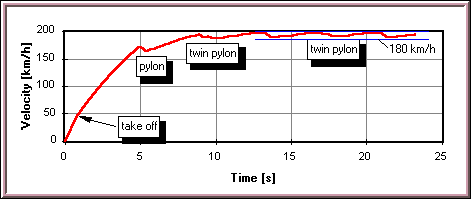
Calculated speed of a national beginner class Quickie 500 model.
The data obtained from these calculations were then used to improve propellers, wings and airfoils. Nowadays, with commercially available and affordable remote data acquisition systems, it is even possible to collect engine and aerodynamic data in flight.
The drag breakdown in the next figure shows, that the rather bulky fuselage and the fixed undercarriage of the Quickie 500 contributes most to the total drag in level flight. This ratio will be lower for the more streamlined F3D competition models according to FAI rules. As the aerodynamicist would expect, the most important drag source during the turns is the induced drag of the wings, which could be reduced by enlarging the wing span, if the span were not fixed by the rules of the Quickie 500 class.
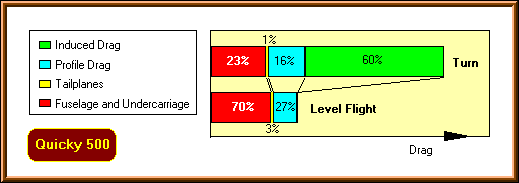
Relative contribution of model parts to the total model drag for two flight
conditions.
On the other hand, a larger wing span is undesirable in level flight and it increases the weight; thus a compromise has to be found to achieve the best results - that's exactly one of the points, which makes the development of models for pylon racing interesting!
Most people tend to say that a high aspect ratio AR = b^2/S reduces the induced drag. But in fact it is the wing span b, which influences the induced drag, not the wing surface S. Keeping the surface at the minimum prescribed value and varying the wing span changes the induced drag. Some results of a span variation for the straight and level flight, from pylon to pylon, are presented in the next figure.
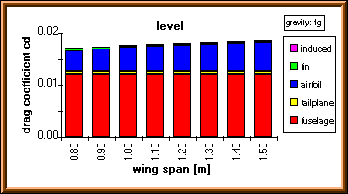
Drag components during level flight for various wing spans.
As already pointed out above, the induced drag is of no importance here. Increasing the wing span forces a reduction of the chord length of the wing to keep the area constant. This results in an increase of profile friction drag due to the decreasing Reynolds numbers. Thus the wing span should small for this flight condition.
Regarding the drag components for a 10 g turn, as shown below, shows the opposite picture. Here, the induced drag is much more prominent, especially when a small wing span has been chosen.
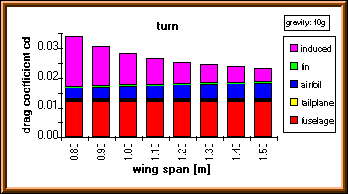
Drag components during a 10 g turn for various wing spans.
The overall optimum depends on the ratio of the times spent during both flight phases. It can be determined by a complete analysis of the flight, or experimentally by trial and error. For this purpose a new simulation program has been written, which makes it possible to perform a realistic optimization of a model (at least theoretically - we are still working on computerized pilot brain control, but the current test pilot is always asking Abort, Retry, Ignore?, when he has cut a pylon and, Unrecoverable Application Error after drilling for oil with his new Nelson).
Last modification of this page: 21.05.18
![]()
[Back to Home Page] Suggestions? Corrections? Remarks? e-mail: Martin Hepperle.
Due to the increasing amount of SPAM mail, I have to change this e-Mail address regularly. You will always find the latest version in the footer of all my pages.
It might take some time until you receive an answer
and in some cases you may even receive no answer at all. I apologize for this, but
my spare time is limited. If you have not lost patience, you might want to send
me a copy of your e-mail after a month or so.
This is a privately owned, non-profit page of purely educational purpose.
Any statements may be incorrect and unsuitable for practical usage. I cannot take
any responsibility for actions you perform based on data, assumptions, calculations
etc. taken from this web page.
© 1996-2018 Martin Hepperle
You may use the data given in this document for your personal use. If you use this
document for a publication, you have to cite the source. A publication of a recompilation
of the given material is not allowed, if the resulting product is sold for more
than the production costs.
This document may accidentally refer to trade names and trademarks, which are owned by national or international companies, but which are unknown by me. Their rights are fully recognized and these companies are kindly asked to inform me if they do not wish their names to be used at all or to be used in a different way.
This document is part of a frame set and can be found by navigating from the entry point at the Web site http://www.MH-AeroTools.de/.