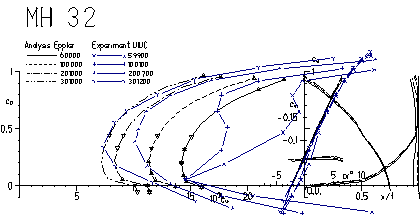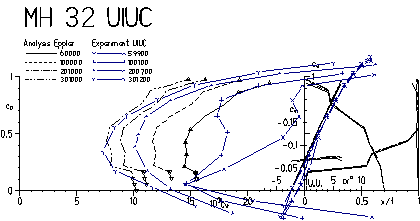
Figure 1: Comparison of test results and predictions.
The airfoil MH 32 has been published in October 1991 in the FMT-Kolleg magazine [3]. The three airfoils MH 30, MH 32, and MH 43 had been presented as airfoils for F5D, F3B and F3E models, all equipped with flaps. Citing from the paper (translated from German):
«For all these airfoils (especially for the MH 30 and the MH 32) an accurate construction method is necessary to achieve the predicted behavior. It is very important to shape the leading edge region with special care. If the effectiveness of the flap is not sufficient, it is recommended to experiment with a thin turbulator on the upper side (for the MH 30 and MH 32 at 60% chord, for the MH 43 at 50% chord).
[...] Nevertheless this airfoil [MH 32] might be well suited for the F3B and the F3E-program, if negative flap deflections are used for the speed flight.».
In 1996 wind tunnel experiments at the UIUC provided results for a wind tunnel model of the MH 32. During the last years, lots of airfoil models have been built and tested during this large, and ongoing campaign. Most of the wind tunnel models used for these tests have not been built by craftsmen, specialized in high precision wind tunnel models, or by using modern numerically controlled manufacturing machines, but instead have been supplied by interested modelers. This method created a lot of wind tunnel models, whose quality ranges from very good to poor, reflecting the skill of the individual builder (it must be noted here, that even expensive, high tech wind tunnel models sometimes show astonishingly large inaccuracies).
In December 1998 another model of this airfoil went into the Modellwindkanal of the Institute of Aero and Gas Dynamics (IAG) at the University of Stuttgart. This wind tunnel has been built with a similar design as the larger Laminarwindkanal of the institute, where all the airfoils of Professor Wortmanns FX-series had been developed. During the 1990s, the Modellwindkanal has been used to a lesser extent and only recently it has been upgraded by a more recent data acquisition system. Most tests in this small tunnel have been conducted by students during their "Studienarbeit" or "Diplomarbeit" (diploma thesis), which are part of their studies.
The first part of this note was written when I got the experimental results from the UIUC tests. The second part was added about a year later, when the IAG results were available.
Of course I was very curious to compare the UIUC wind tunnel results with the numerical predictions, using the Eppler code, which had also been used for the design of these airfoils. Figure 1 shows the test results, together with the polars as obtained from Epplers PROFIL code.

Figure 1: Comparison of test results and predictions.
The comparison showed, that the upper half of the laminar bucket matched the predictions perfectly at Reynolds numbers of 200'000 and 300'000 (the comparison looks almost too good). At lower Reynolds numbers the usual laminar separation bubble increased the drag, which had also been expected after application of Drelas XFOIL analysis code. At lower Reynolds numbers the lift coefficient for a given angle of attack was lower than the predictions, which is also typical (the Eppler analysis neglected the boundary layer displacement effect and could not handle separation bubbles).
The experiments found the lower end of the laminar bucket much earlier than intended: at Reynolds numbers above 100'000 the wind tunnel results showed increasing drag when the lift coefficient fell below 0.25 approximately. Unfortunately the available data points are spaced by about 0.1 to 0.2 in cl, which gives no very sharp definition of the lower end of the bucket.
In spite the fact, that the airfoils had been designed with negative flap deflections for the lower lift coefficients, thinking of speed flight at higher Reynolds numbers and lo lift coefficients, the results were disappointing.
Regarding Reynolds numbers of 100000 and below, we find, that the lower border of the bucket catches up with the predictions. Its width is shrinking when the Reynolds number increases above 100'000. This behavior indicates that transition on the lower surface moves rapidly forward, which is often observed on typical laminar flow airfoils with relatively thin leading edges of low curvature, which was not exactly matching the design philosophy of the MH 32.
As it is generally done in most industrial wind tunnel tests (but not at all universities), the team at the UIUC has decided to measure the actual coordinates of the wind tunnel models. These coordinates were compared with the definition of the MH 32 and showed larger deviations on the lower surface, close to the leading edge. The leading edge of the model is more pointed and thinner than the definition, the largest deviation close to the leading edge is approximately 0.25% of the chord, which amounts to 0.75 mm for a 300 mm chord. This is already quite large for a typical model using this airfoil (most contest models are built in molds) and very much for a wind tunnel model.

Figure 2: Geometry of wind tunnel model and airfoil definition (click to zoom
in).
The geometry of the wind tunnel model was slightly smoothed (actually two points have been modified and a new point distribution has been created using an exponential spline) and analyzed. The results of the Eppler code show a slightly jagged transition location, which is also reflected by the Cl versus Cd polar. Further smoothing would have removed the kinks, but this would also have altered the airfoil shape, which was not desired (an optical inspection of the shape shows no corners, but Eppler's 3rd order panel code is very sensitive to surface imperfections).

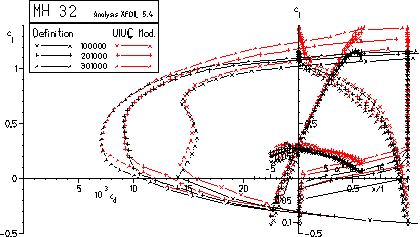
Figure 3: Polars of the wind tunnel model, calculated with Epplers airfoil code.
The corresponding polar of the wind tunnel model, shown in figure 3, still shows a reasonable agreement in the upper border of the laminar bucket, but - more interesting - the lower limit of the laminar bucket has also moved up by nearly 0.2 in Cl.
It is known, that the Eppler code is very sensitive to waves and kinks in the airfoil shape. Thus another analysis of the airfoil definition and the wind tunnel model was performed using the XFOIL code. The results, presented in figure 4, show a similar effect on both sides of the low drag region. The lower limit of the bucket is moving by approximately 0.1 in Cl.

Figure 4: Polars of both coordinate sets, calculated with XFOIL.
Finally, another wind tunnel model of the MH 32 was provided by the German/Swiss LOGO-team, and a series of tests at the Modellwindkanal of the IAG at Stuttgart were conducted by Rüdiger Keck. As the model was equipped with a plain flap, tests were made with typical flap settings for F3B models, namely -3°, 0°, 5° and 10°.
Figure 5: Comparison of polars for the airfoil with 0° flap deflection (click to enlarge).
The pictures above show all the available results for this airfoil at two different Reynolds numbers. Again, the drag polar for Re=100'000 shows the drag increase due to the laminar separation bubble at medium lift coefficients. The experiments look very similar, but the results from Stuttgart extend the useful range of lift coefficients down below zero lift. Again, Xfoil underpredicts the drag at the upper border of the laminar bucket (this might be the result of an overprediction of the lift caused by the separation bubble). The deviations between both sets of experimental data are very small, considering the small Reynolds number and that the wind tunnel model was not identical. The results from Eppler, Xfoil and Stuttgart at Re=200'000 are even more close together (the scaling of the axis for the drag coefficient is already quite enlarged). Again, Xfoil shows that unnatural low drag bucket at lift coefficients above 0.4, probably caused by the modeling of the separation bubble. Below this lift coefficient, the results from Stuttgart fall nearly on top of the Xfoil results, and the shape of these experimental results id very similar the the Eppler prediction. It has to be remarked, that the analysis by the Eppler code as well as by Xfoil assume a smooth surface, whereas the wind tunnel model at Stuttgart was equipped with a flap, even for these «unflapped» cases. A larger deviation between the UIUC and the IAG test results occurs at lower lift coefficients, confirming the influence of the shape distortion elaborated above.
The drag analysis of the design and the wind tunnel model coordinates
indicate, that it is necessary to try to reproduce the airfoil shape as
perfectly as possible if you want to achieve the design performance of an
airfoil or wing. The shape of the leading edge region has a strong influence on
the width of the laminar bucket. The numerical methods seem to be able to
reproduce the same trends, that can be found in wind tunnel tests. Using wind
tunnel data for comparisons and the selection of airfoils is only possible, if
the true airfoil shape is built into the wind tunnel model or if the coordinates
of the wind tunnel model are used to build the aircraft.
Nevertheless, a comparison of the results with the numerical predictions can
give an interesting insight into the losses, which can be expected from
imperfect building techniques and shape modifications.
For a comparison of high performance airfoils it is desirable to build the wind tunnel models to a high standard, because the direction of the deviations on the final aircraft is not known in advance. Today, the use of CNC machines for wind tunnel models or at least for templates makes it possible to create very accurate models - for wind tunnel tests as well as for flying models.
See also: Some Remarks on Experiments
Last modification of this page: 21.05.18
![]()
[Back to Home Page] Suggestions? Corrections? Remarks? e-mail: Martin Hepperle.
Due to the increasing amount of SPAM mail, I have to change this e-Mail address regularly. You will always find the latest version in the footer of all my pages.
It might take some time until you receive an answer
and in some cases you may even receive no answer at all. I apologize for this, but
my spare time is limited. If you have not lost patience, you might want to send
me a copy of your e-mail after a month or so.
This is a privately owned, non-profit page of purely educational purpose.
Any statements may be incorrect and unsuitable for practical usage. I cannot take
any responsibility for actions you perform based on data, assumptions, calculations
etc. taken from this web page.
© 1996-2018 Martin Hepperle
You may use the data given in this document for your personal use. If you use this
document for a publication, you have to cite the source. A publication of a recompilation
of the given material is not allowed, if the resulting product is sold for more
than the production costs.
This document may accidentally refer to trade names and trademarks, which are owned by national or international companies, but which are unknown by me. Their rights are fully recognized and these companies are kindly asked to inform me if they do not wish their names to be used at all or to be used in a different way.
This document is part of a frame set and can be found by navigating from the entry point at the Web site http://www.MH-AeroTools.de/.